
The main objective of this study is to assess the costs and benefits of on-farm storage investments for grain producers in Algoma. As production of grains and oilseeds increase in our region, the ability to dry and store these products has many advantages:
- Manage cash basis for income tax
- Avoid harvest delays
- Manage transportation logistics
- Avoid moisture discounts
- Capture increasing futures market value
- Local feed availability and purchasing
- Support local oilseed demands and centralized storage infrastructure
Three market sectors for crop growers in Algoma have been identified as:
- Commodity crops
- Feed crops
- New/specialty crops
RAIN Research Note 010615
Download PDF
COMMODITY CROPS
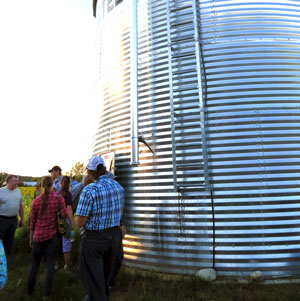
The most common way to store grains and oilseeds is on-farm grain bins. This technology has many benefits, but high capital costs are a deterrent for Algoma farmers looking to start or expand their cropping operations. Maintaining consistent product moisture and capturing increased market price are the main advantages justifying the cost of these storage systems.
FILM (Farm Infrastructure and Loan Model)
The FILM was developed to assess the financial attractiveness of farm infrastructure investments for Algoma farmers. This cost-benefit model investigates the return on your infrastructure investment by evaluating the total project net present value (NPV) over the lifespan of the infrastructure, the internal rate of return (IRR) on that investment and the payback period (time it takes to pay back the capital cost based on its financial benefits).
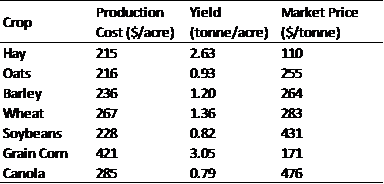
Table 1 – Summary of production scenario
Model Assumptions for Cash Crop Production
A five-year crop rotation on 200 acres was used as a basis for production (1-canola, 2-soybeans, 3-wheat, 4-hay, 5-hay). Production costs were estimated based on crop budget worksheets1 and custom farmwork rates2 and adjusted as needed to reflect local conditions (i.e. transportation, Table 1). Crop yields were kept conservative and based on local knowledge and regional averages3,4. Crop market prices were derived from current trends (Figure 1) and reflect cash market prices5. This economic model also assumes that the producer owns planting machinery and utilizes custom harvesting. Based on crop yield estimates and acreage a two-bin installation is used (5000 bushel stirator and 10,000 bushel bin). Government incentives of 15% and 50% were assessed and include capital interest at 2.5% over 10 year amortization period. Government incentive programs could include Northern Ontario Heritage Fund’s Northern Business Opportunities Program6 or Growing Forward 2 for Producers7 at varying cost-share arrangements. A discount rate of 4.5% was used for all NPV calculations and a 5% discount on quality for high moisture content was applied to non-aerated product.
Analysis Scenarios
Six scenarios are assessed considering changes in 1) government incentive (15% and 50%), and 2) increases in market price received (5%, 15%, and 25%). Variations in market conditions were also considered in development of project scenarios5.

Figure 1. Five year historical price trends ($CDN/tonne) for canola and soybeans
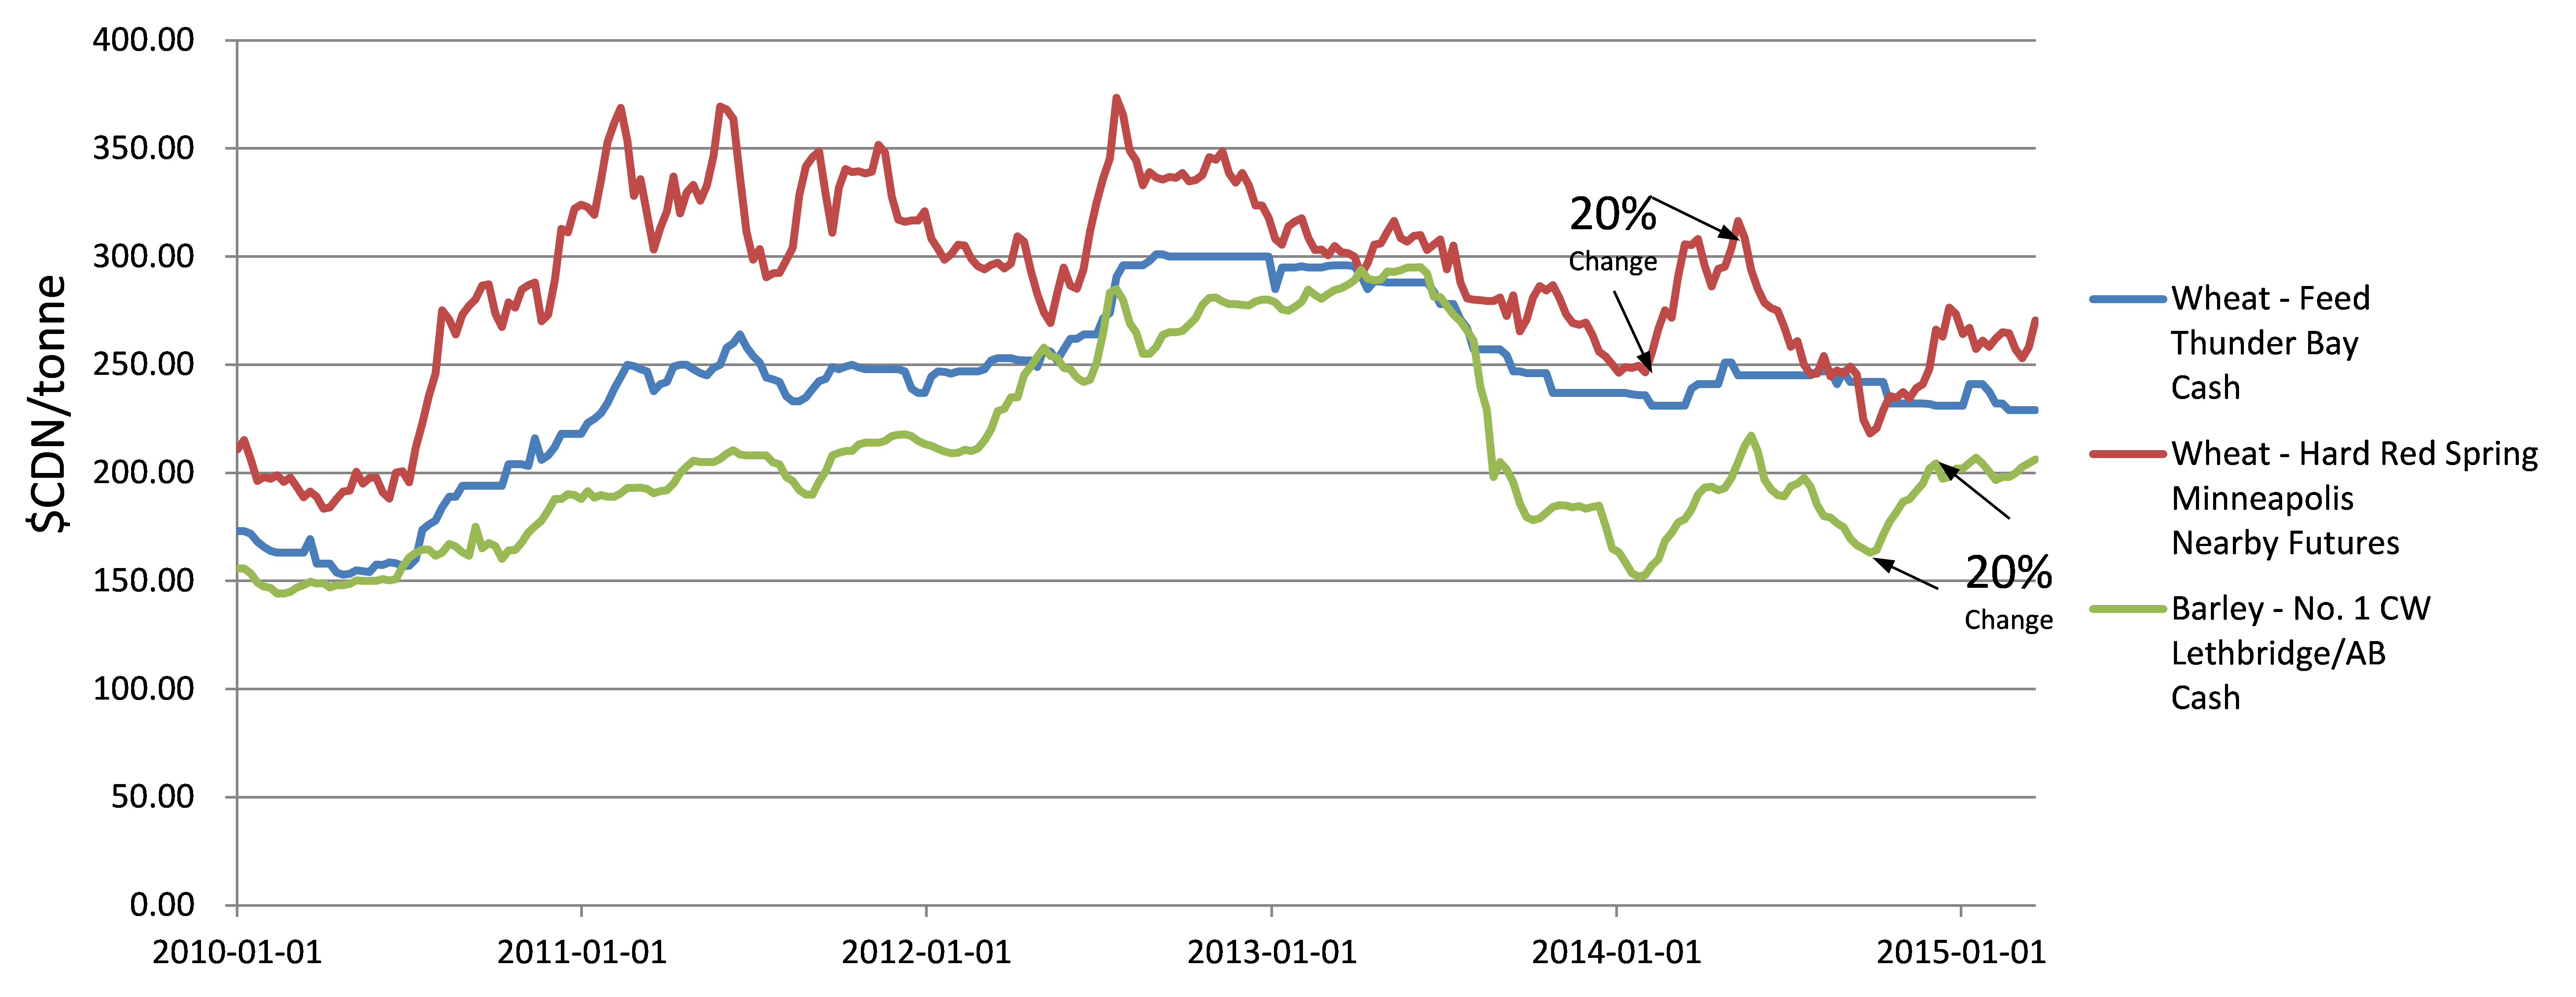
Figure 2. Five year historical price trends ($CDN/tonne) for wheat and barley.
Results
Payback periods for grain bin investments ranged from 4 years to 7 years with a 50% government incentive and from 6 to 13 years with a 15% government incentive (Figure 2). The internal rate of return (IRR) at year 5 ranged from -8% to 37% for the 50% government incentive scenarios and -27% to -1% for 15% government incentive scenarios. Annual gross margins for producers increased on average $7212, $10818, and $14424 for market prices increases of 5%, 10% and 15%, respectively.
Discussion
High volatility is present in today’s cash crop commodity markets with seasonal fluctuations at times over 20%. Yearly fluctuations are also customary with weather patterns and supply concerns driving these conditions. The advantage of grain storage is clear where even without government incentives, grain bin investments in our scenario can be paid back as quick as 7 years if a 15% increase in market price is achieved. It is important to note that operational scale has some impact on these results. For example, a 100 acre cropping operation requires less capital, but the ability to payback this investment takes longer due to reduced overall revenues. An incentive program covering 50% of the capital costs would greatly reduce the risk for producers, where the range of payback periods was 4 to 7 years compared to 15% having a range of 6 to 13 years. It is also very important to remember that there is no guarantee the producer will garner increased prices as seen in the overall drop in most commodities in May 2013 due to continental supply concerns. For Algoma producers, risks such as a cold and unpredictable climate and reliance on long distance transportation to markets make large capital costs difficult to overcome. As economic uncertainty still looms in both the USA and Canada, a high investment risk remains for large infrastructure investments tied to commodity markets.
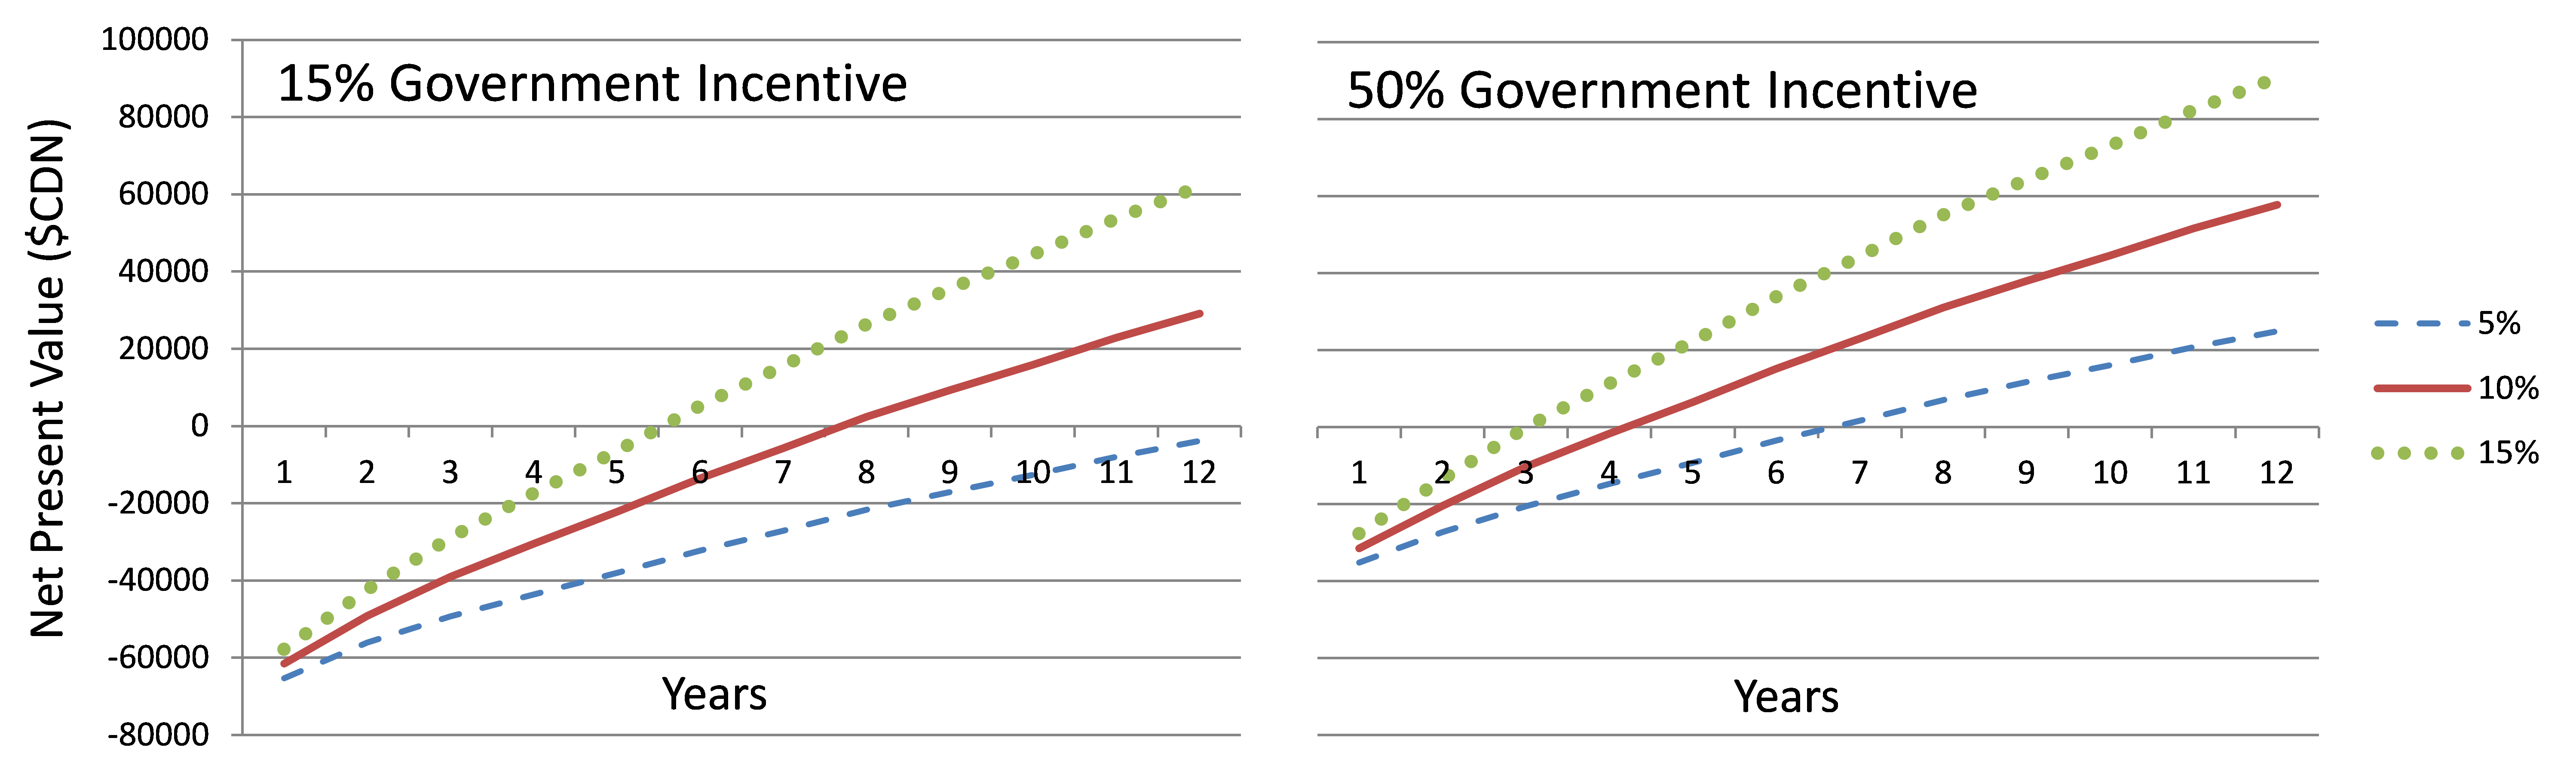
Figure 3. Net Present Value (NPV) of storage bin infrastructure project for individual producer for 15% and 50% government incentives and 5%, 10%, and 15% increased market price. Agronomics are detailed in the model assumption section.
References
1www.omafra.gov.on.ca/english/busdev/facts/pub60.pdf
2http://www.omafra.gov.on.ca/english/busdev/2012customrates.htm
3 http://msue.anr.msu.edu/topic/info/field_crops
4 http://www.gfo.ca/Production.aspx
5 Agriculture and Agri-Food Canada – Weekly Price Summary
7 www.omafra.gov.on.ca/english/
For more information on this project, please contact:
Saul Fraleigh
Agriculture Researcher
Email: sfraleigh@ssmic.com
Phone: 705-942-7927 x3034